
Trees Height calculation using drone mapping data
 Tasnuva Tabassum Oshin
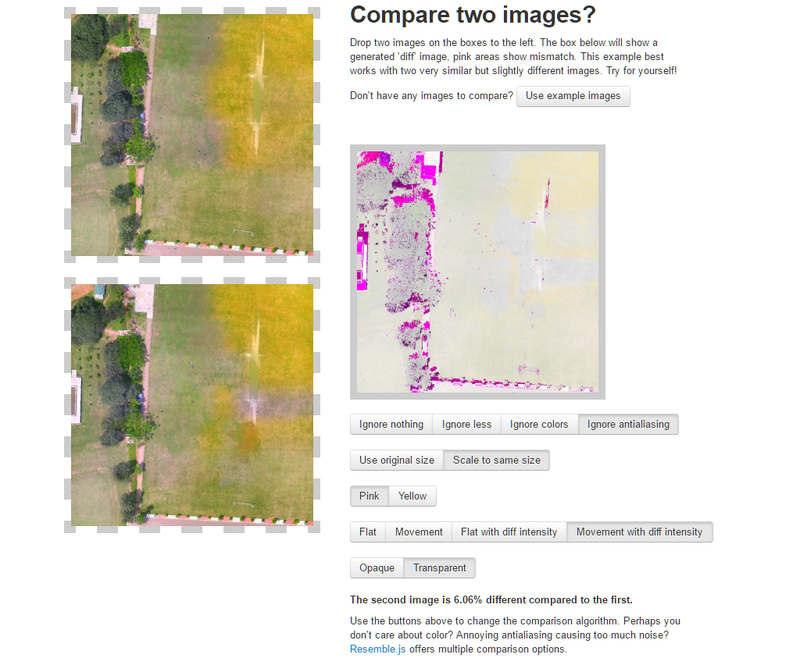
Two Different map analysis Data
Tasnuva Tabassum Oshin 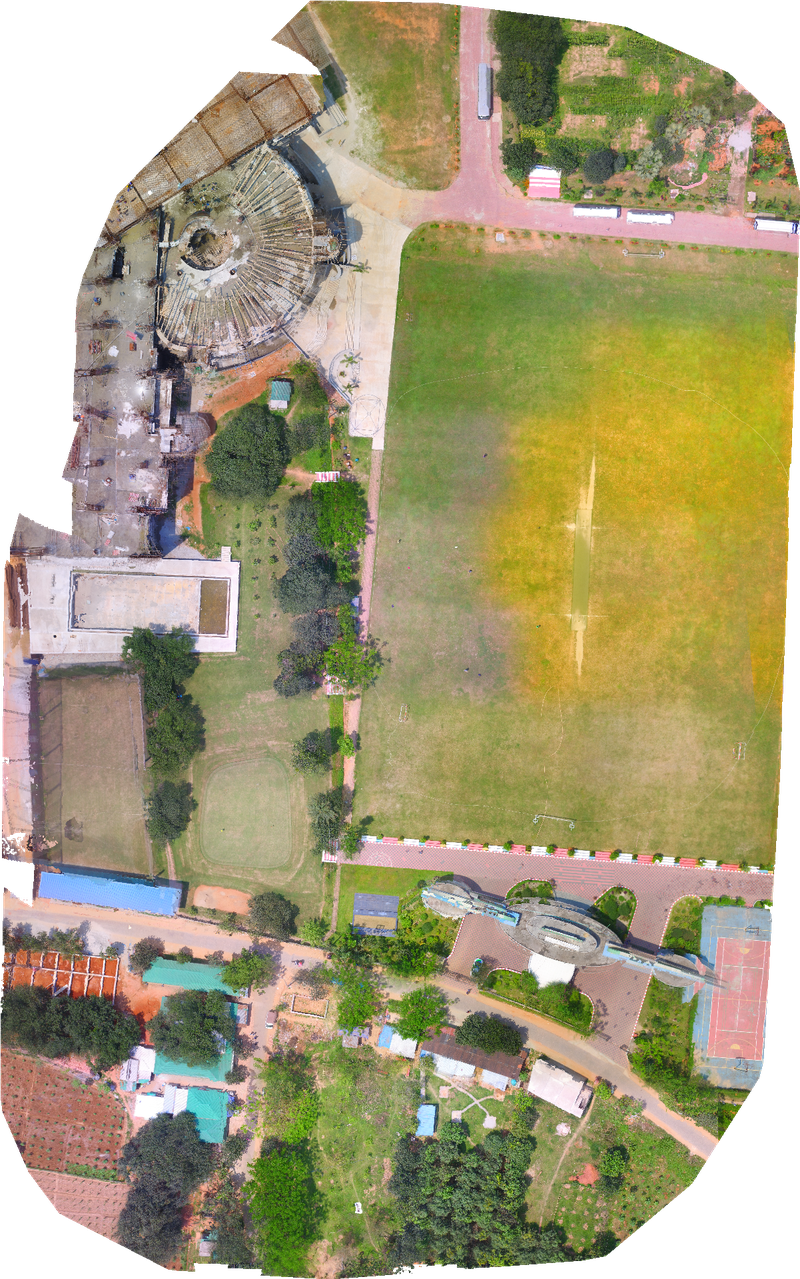
Final map ( 1st mapping )
Tasnuva Tabassum Oshin 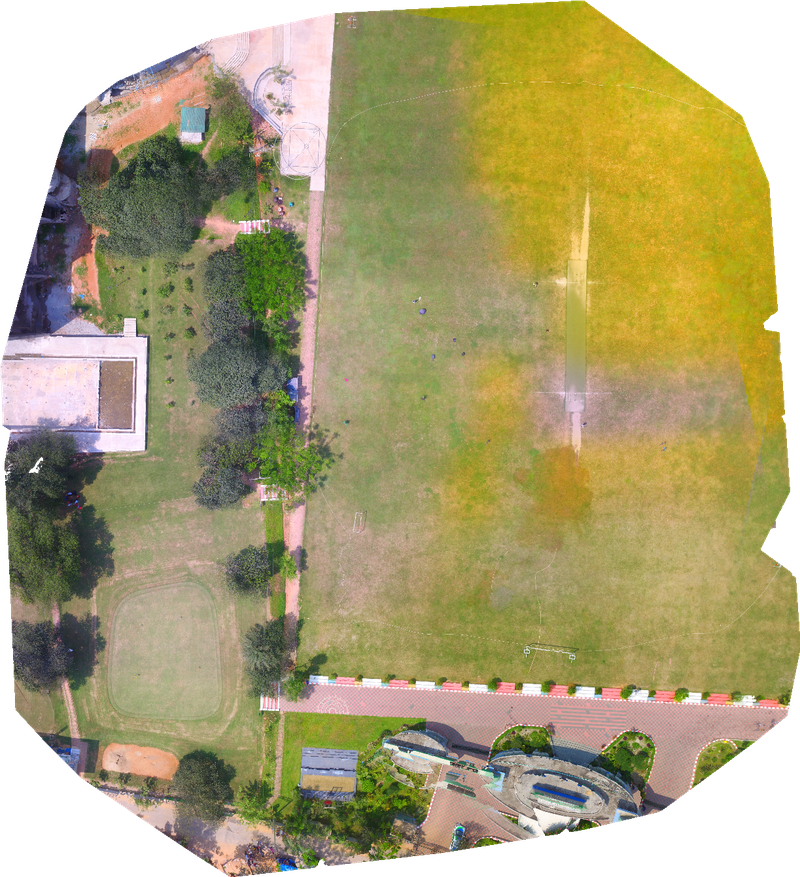
Final Map ( 2nd mapping )
Tasnuva Tabassum Oshin 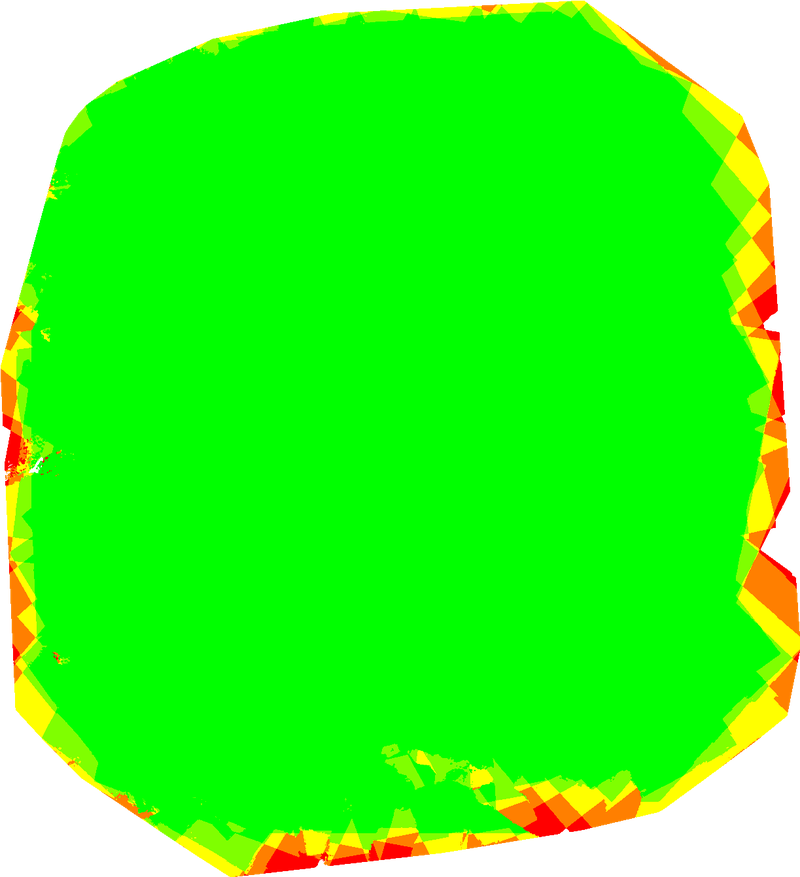
orthomosaic_overlap ( 2nd mapping )
Tasnuva Tabassum Oshin 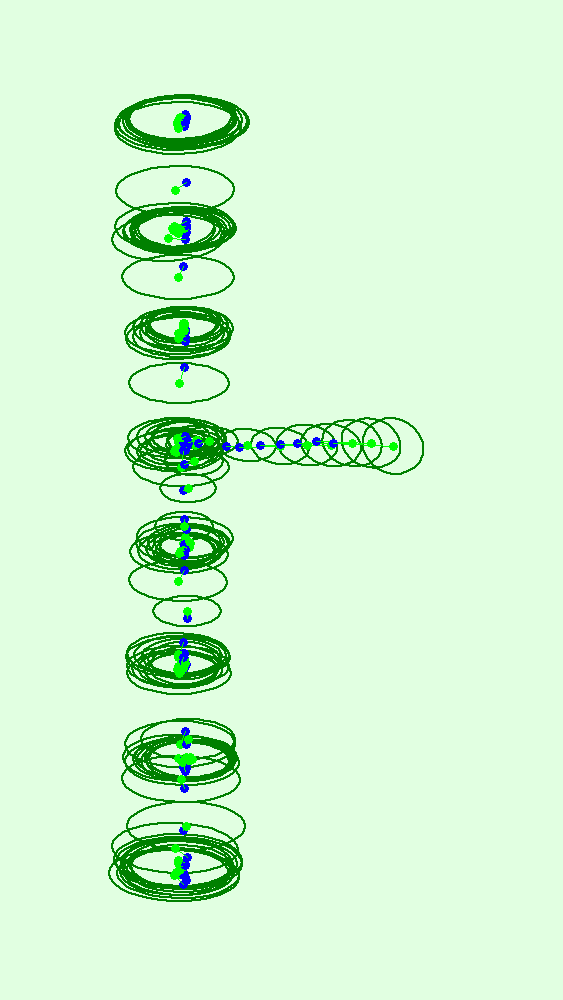
optimized_camera_position_YZ ( 2nd mapping )
Tasnuva Tabassum Oshin 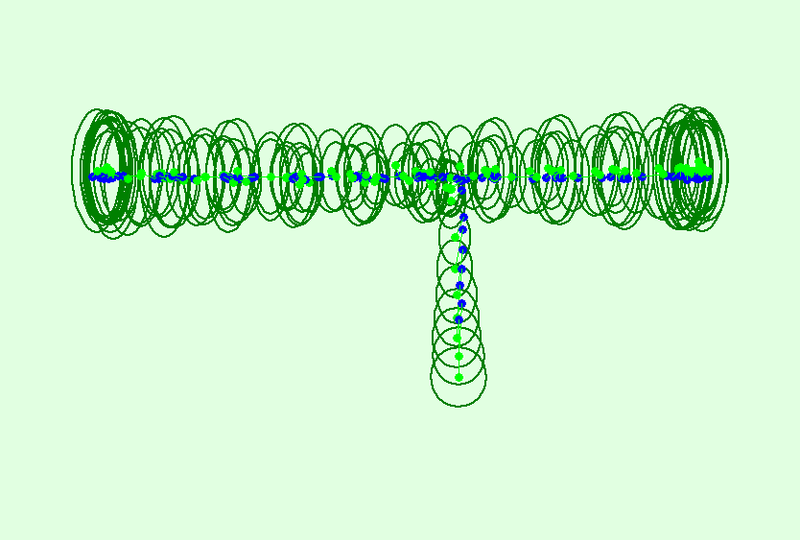
optimized_camera_position_XZ ( 2nd mapping )
Tasnuva Tabassum Oshin 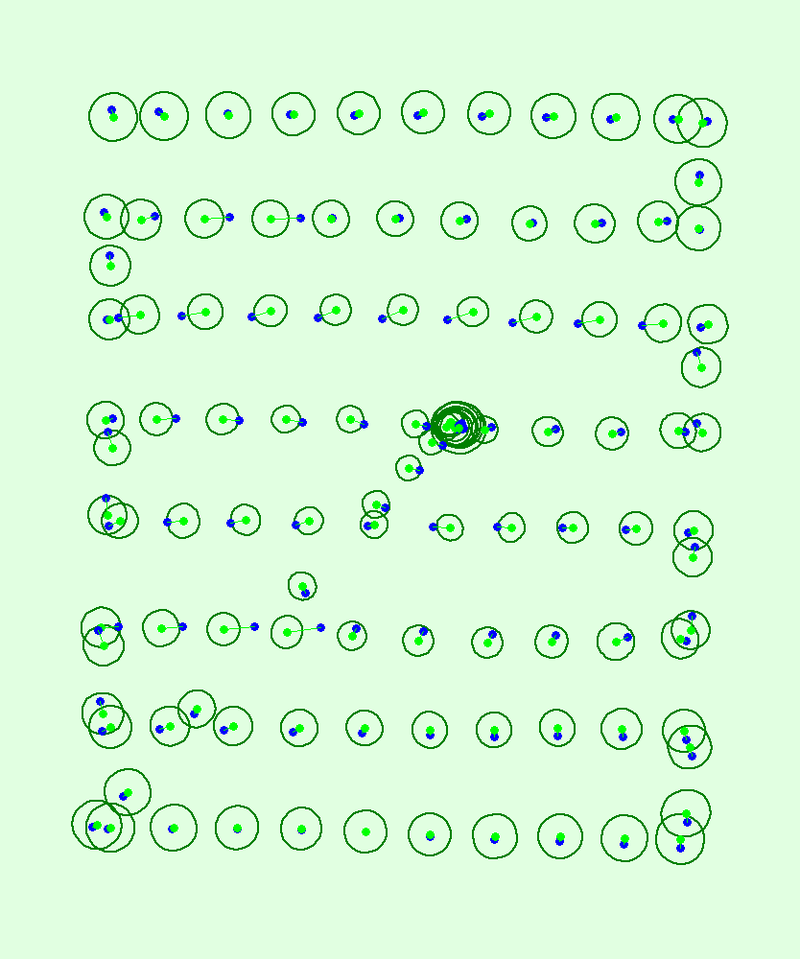
optimized_camera_position_XY ( 2nd mapping )
Tasnuva Tabassum Oshin 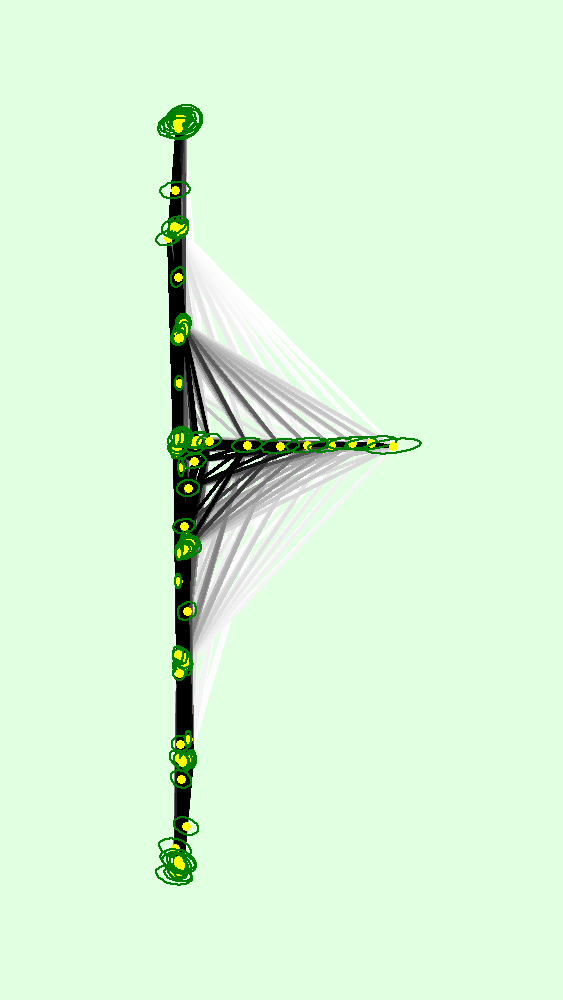
matches_graph_YZ ( 2nd mapping )
Tasnuva Tabassum Oshin 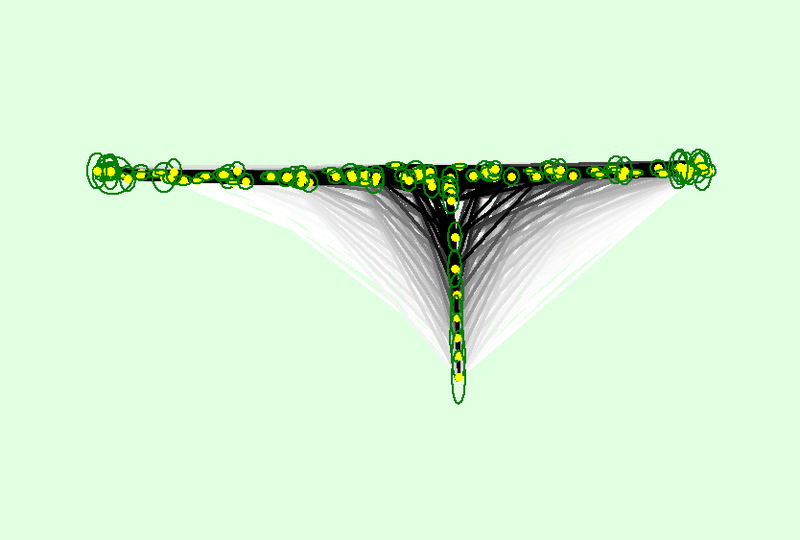
matches_graph_XZ ( 2nd mapping )
Tasnuva Tabassum Oshin 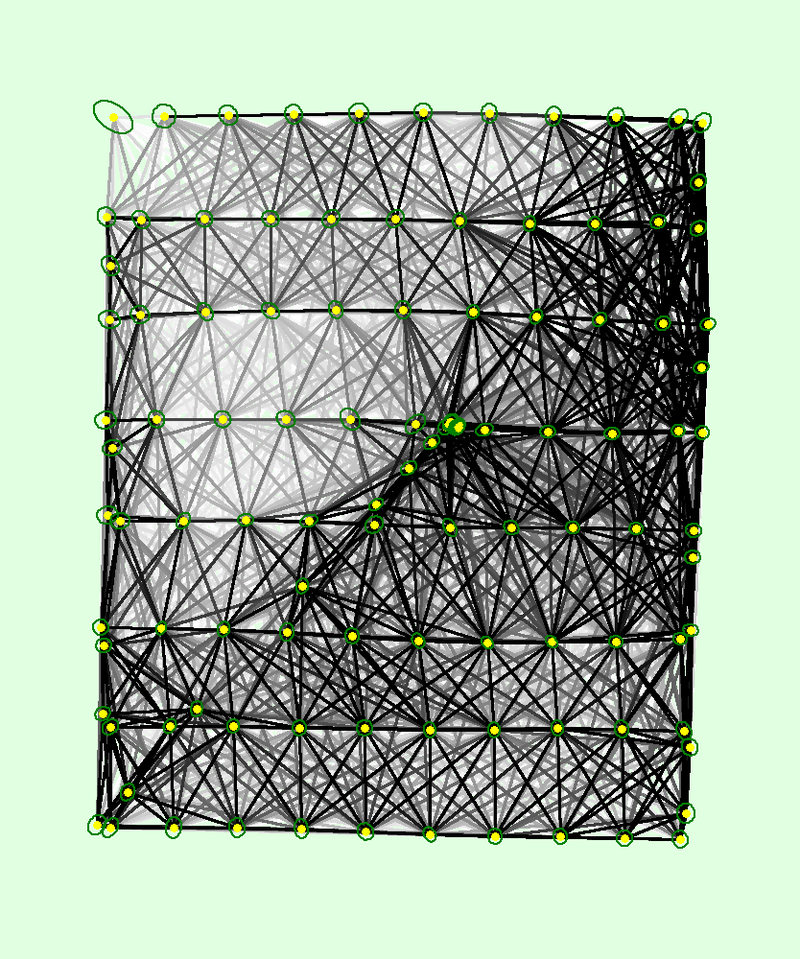
matches_graph_XY ( 2nd mapping )
Tasnuva Tabassum Oshin 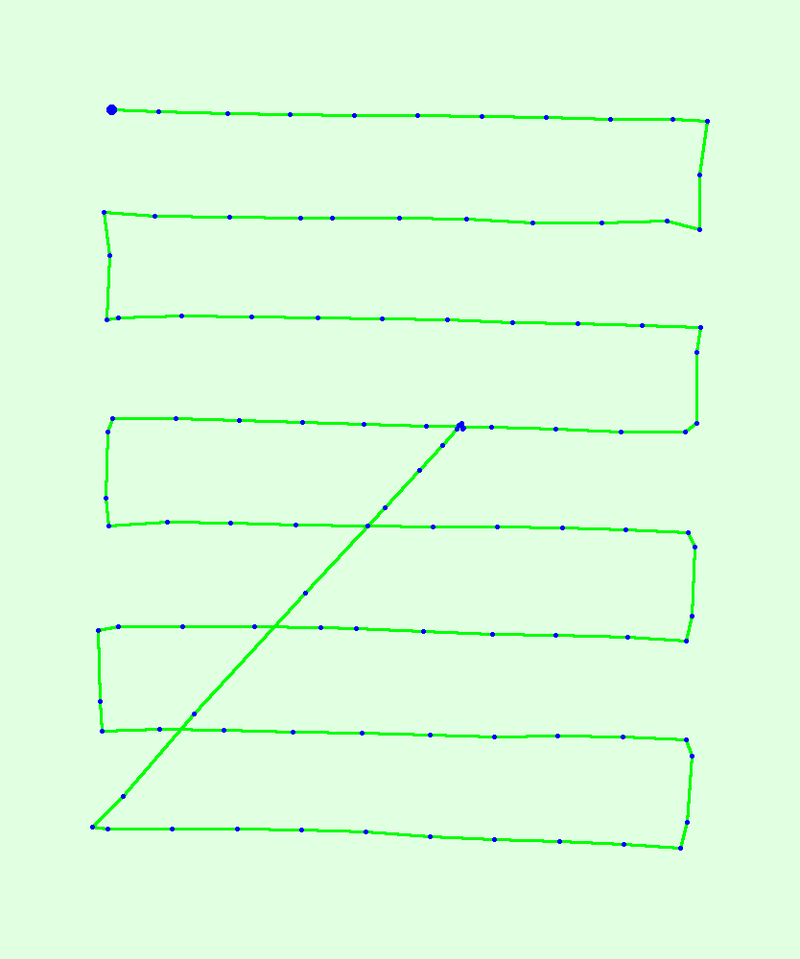
geotag_position ( 2nd mapping )
Tasnuva Tabassum Oshin 
FC300X_3.6_4000x3000 (RGB)(1)_scaled_pixel_error ( 2nd mapping )
Tasnuva Tabassum Oshin 
FC300X_3.6_4000x3000 (RGB)(1)_pixel_error ( 2nd mapping )
Tasnuva Tabassum Oshin 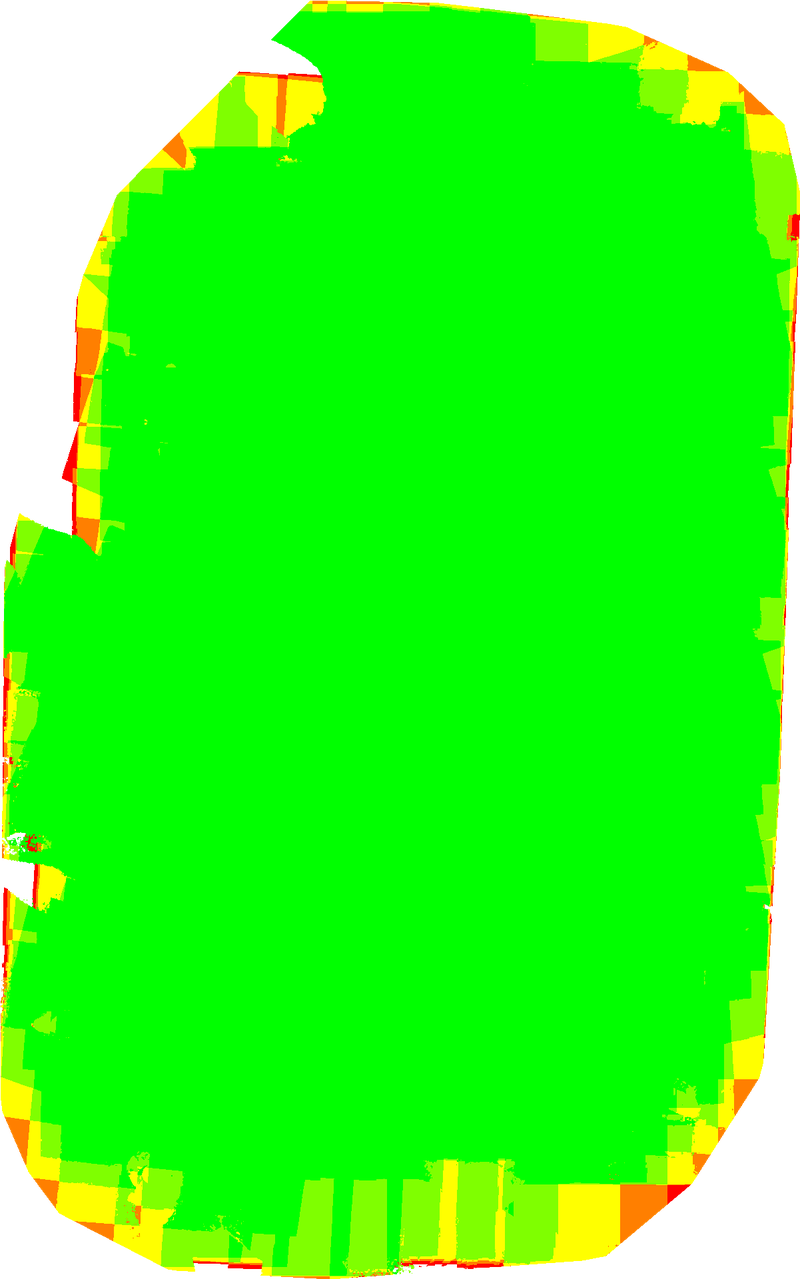
orthomosaic_overlap ( Mapping one )
Tasnuva Tabassum Oshin 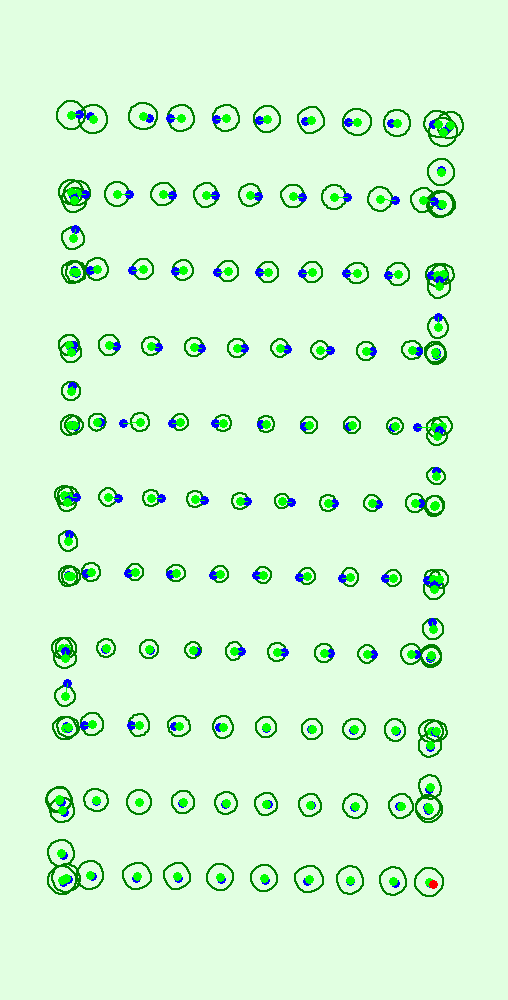
optimized_camera_position_XY ( mapping one )
Tasnuva Tabassum Oshin 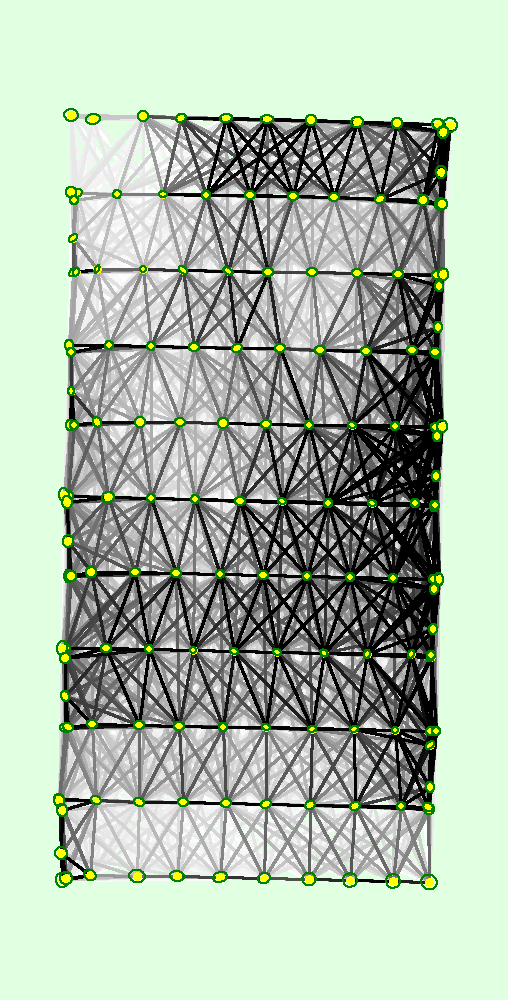
matches_graph_XY ( mapping one )
Tasnuva Tabassum Oshin 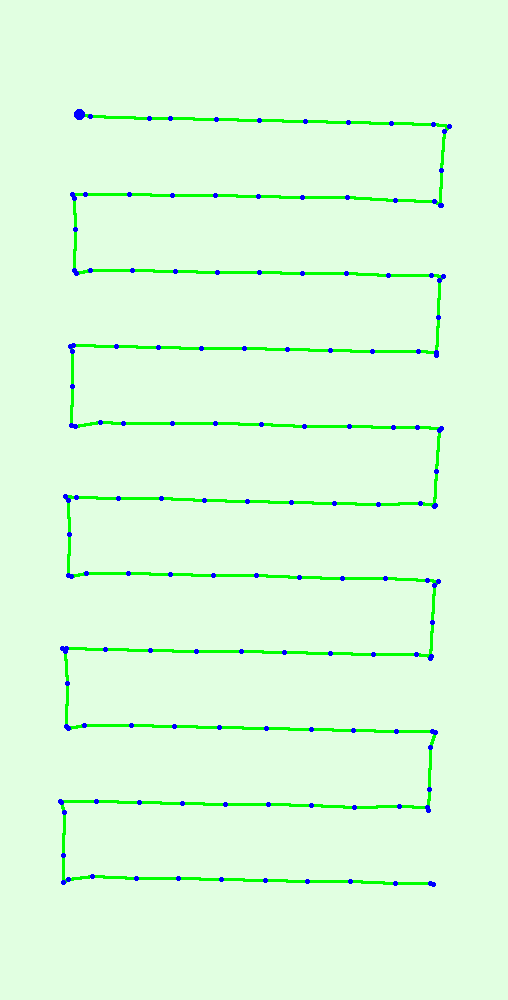
geotag_position ( Mapping one )
Tasnuva Tabassum Oshin 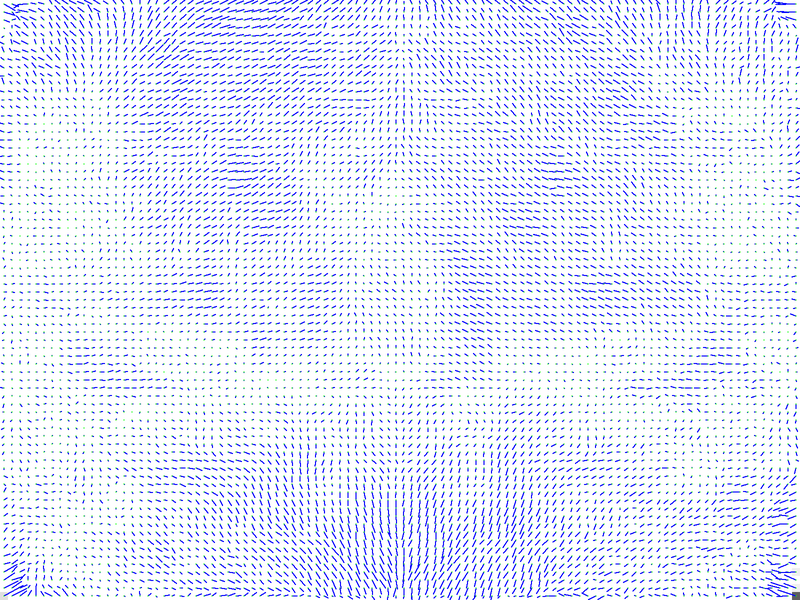
FC300X_3.6_4000x3000 (RGB)(1)_pixel_error ( mapping one )
Tasnuva Tabassum Oshin 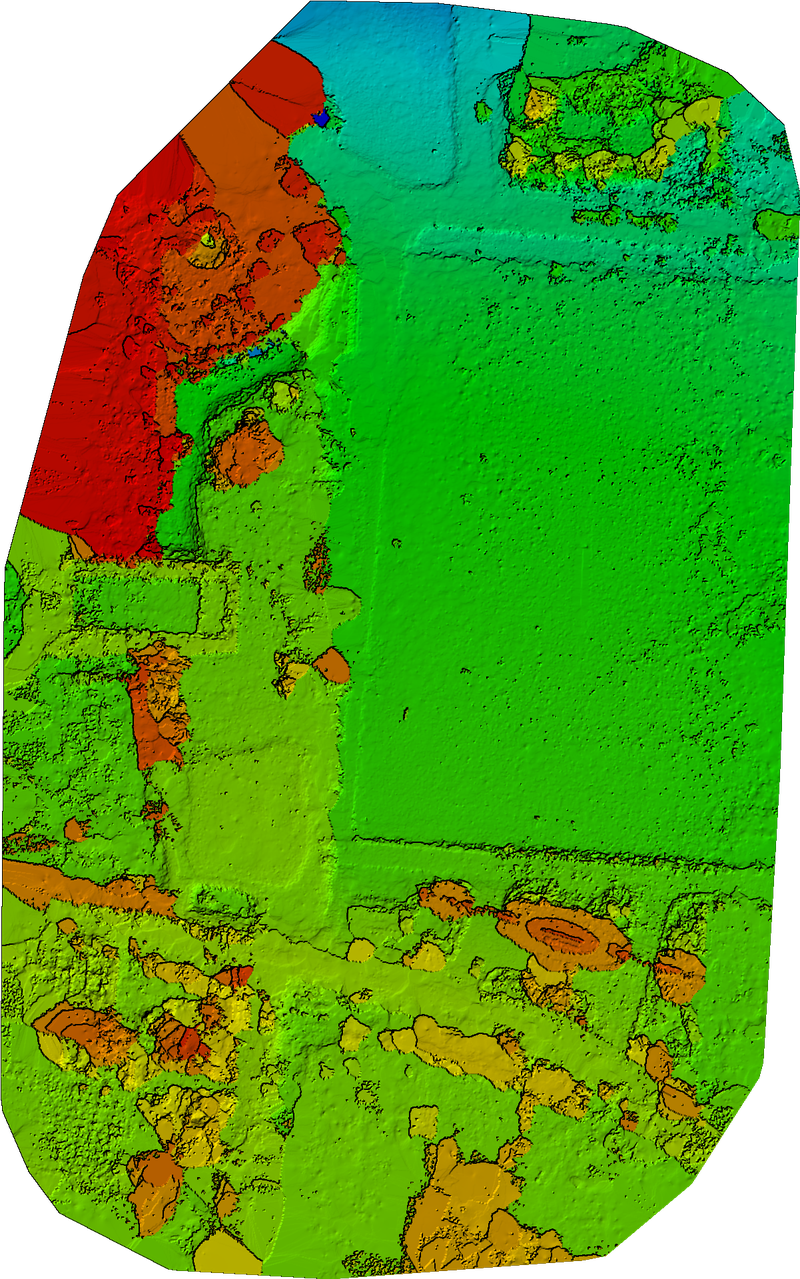
dsm_preview ( mapping one )
Tasnuva Tabassum Oshin 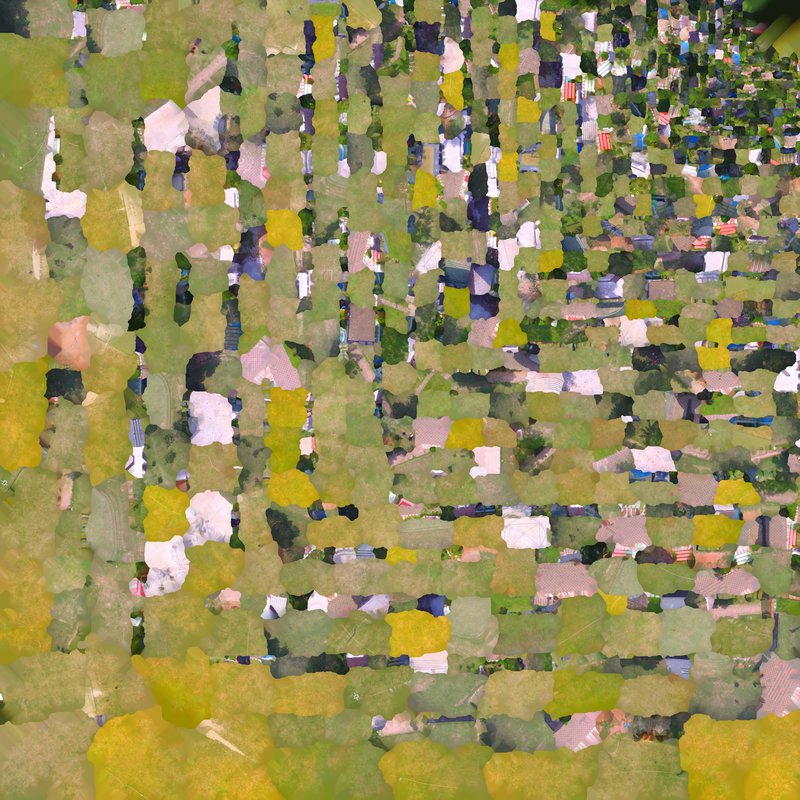
texture
Tasnuva Tabassum Oshin  Nahid Ferdous
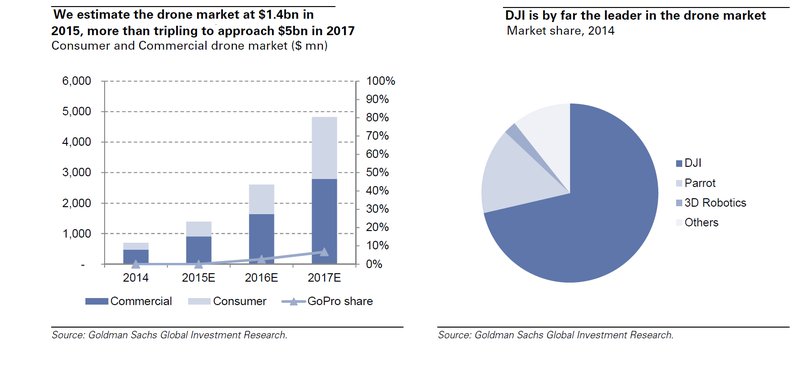
Drone Market Analysis
Nahid Ferdous Drone For Green ( Data collection and Analysis Part one )
Nahid Ferdous satellite data analysis Shundorbon , Bangladesh Drone For Green Project
Nahid Ferdous Full Project summary
“Unmanned Aerial Vehicle based assessment of canopy cover and deforestation dynamics”
Nahid Ferdous 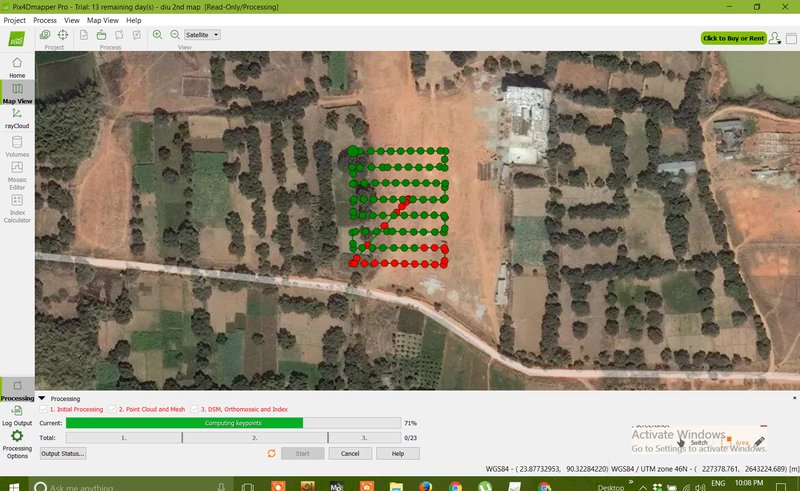
Map Processing
Nahid Ferdous Concerns and opportunities
•Different forest structures, canopy cover levels, and tree spatial distribution patterns may give the same NDVI value.
•Information from the Bangladesh Forest Department forest inventory plots can be used to evaluate NDVI variability on forested plots.
•UAV imagery can provide accurate and precise estimates of canopy cover over many contiguous Landsat imagery cells.
•Monitoring of spectral change through time likely to improve established relationships between NDVI and forest distribution
Nahid Ferdous Challenges
•There is no standard NDVI value threshold distinguishing forests from other types of vegetation
•Effect from season progression
•Other spectral metrics, ancillary information, and monitoring of metric values through time for a given location usually very useful
•Corroboration of predictions with ground observations critical
Nahid Ferdous NDVI-based assessment of vegetation change
•Get Landsat image for area of interest at time T1
•Calculate NDVI (if not already available)
•Repeat for same area at time T2
•Compute new band as NDVIT2 – NDVIT1
•Display the new band
Nahid Ferdous 
Normalized
Nahid Ferdous 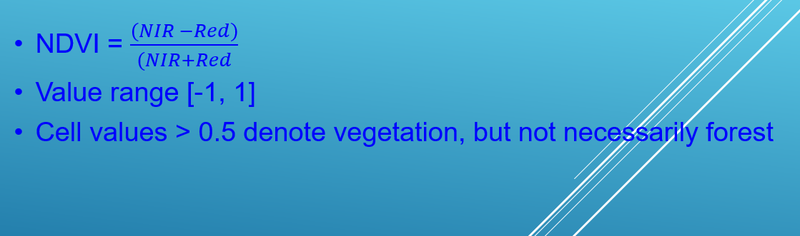
NDVI
Nahid Ferdous 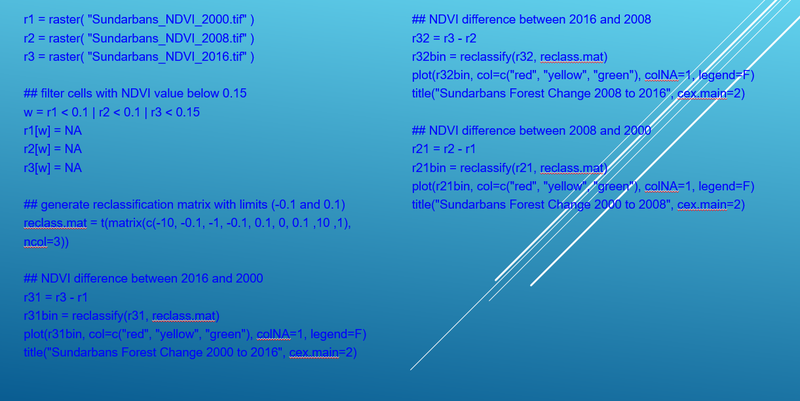
R code used in the examples
Nahid Ferdous 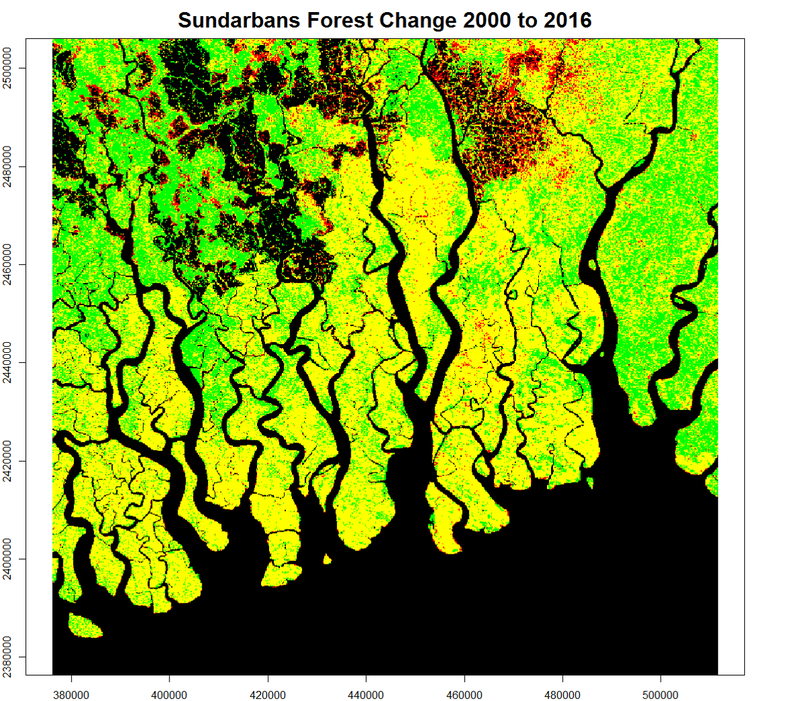
Several deforestation events in the forest, but substantial reforestation too. Artifacts near the edge of water Deforestation (red) No change (yellow) Reforestation (green)
Nahid Ferdous 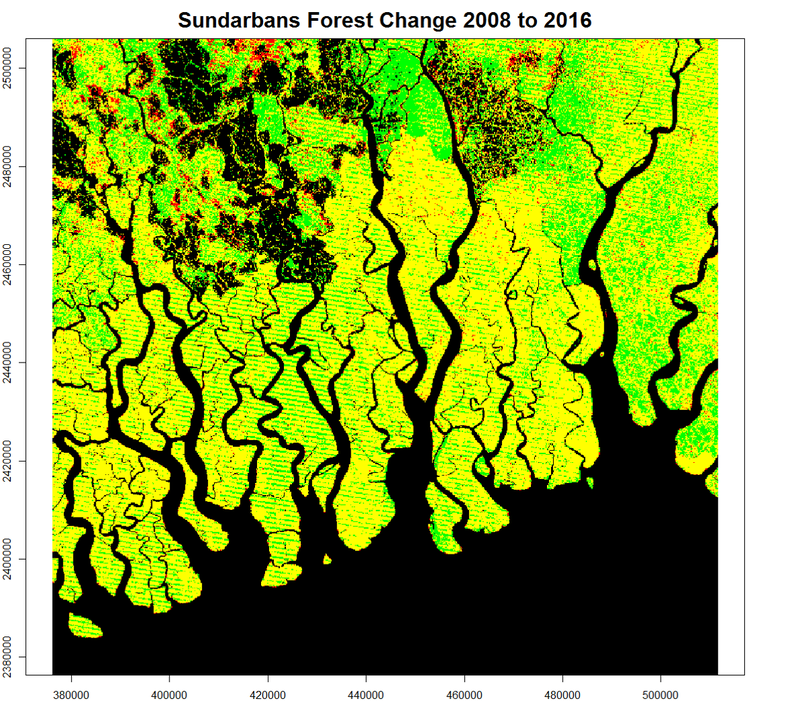
More reliable assessment thank to no sensor issues Sporadic deforestation events in the forest, but substantial reforestation too Deforestation (red) No change (yellow) Reforestation (green)
Nahid Ferdous 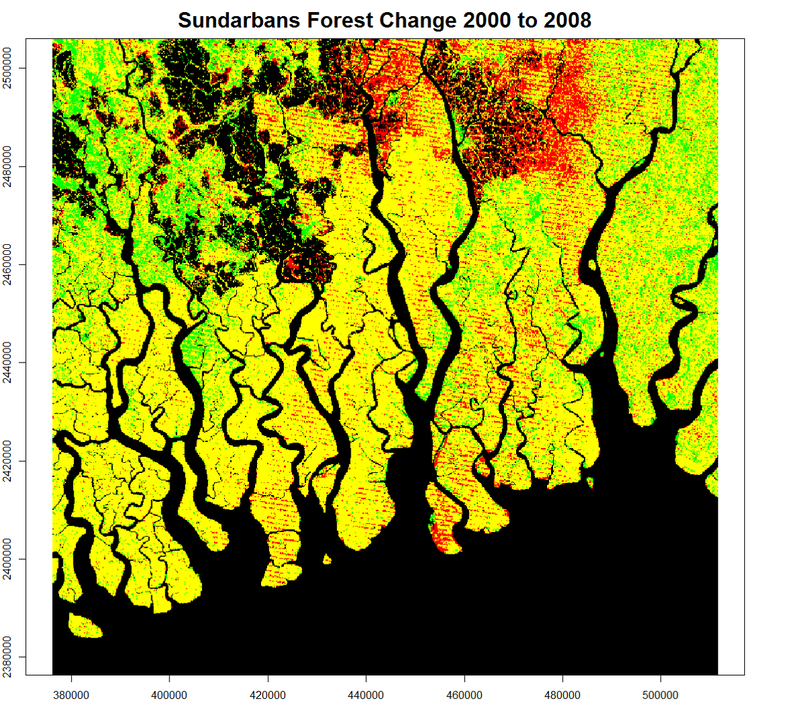
Lots of artifacts because of 2008 data stripping issue , Deforestation (red) No change (yellow) Reforestation (green
Nahid Ferdous 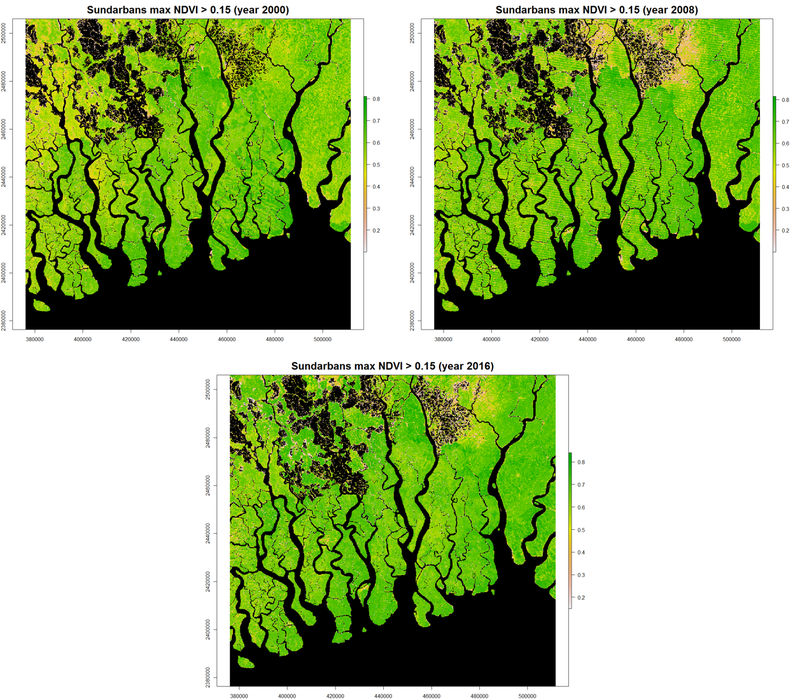
With masking of cell with value below 0.15 Challenging to quantify challenge with ocular means
Nahid Ferdous ![Landsat 8 data Value range [0.00 to 0.86] (more consistent) thanks to new sensor](/assets/images/stream-imagesuK_sGVMHgoUvHYbJa_k8YGDRMC82458width-800.png)
Landsat 8 data Value range [0.00 to 0.86] (more consistent) thanks to new sensor
Nahid Ferdous ![Landsat 7, data Stripping issue from sensor degradation evident Value range [-0.31 to 0.82]](/assets/images/stream-imagesvg_NDBucxfaVMjR19q8iDFJMmJ02457width-800.png)
Landsat 7, data Stripping issue from sensor degradation evident Value range [-0.31 to 0.82]
Nahid Ferdous ![Landsat 7 data, Value range [-0.34 to 0.83] , Minor ocean patterns noticeable](/assets/images/stream-imagesuGaHsqxnKhE2Fzb0mims0ahvjjE2454width-800.png)
Landsat 7 data, Value range [-0.34 to 0.83] , Minor ocean patterns noticeable
Nahid Ferdous | var landsat = ee.Image('LANDSAT/LE7_L1T_ANNUAL_GREENEST_TOA/2000') |
| |
| .select(['greenness']); |
| |
| Export.image.toDrive({ |
| |
| image: landsat, |
| |
| description: 'NDVI_2000_', |
| |
| scale: 30, |
| |
| region: Sundarbans, |
| |
| maxPixels: 2500000000, |
| |
| crs: 'EPSG:3106' |
| |
| }); |
Nahid Ferdous 


